Rates, Commodities and Inflation Clues
I originally typed up most of this in early to mid June, but have been delayed in shipping. Luckily, many of my observations have played out quite nicely since then so I’ve kept the mid-June charts in as well :)
To summarize the current state of play - the economy is holding up, labor markets do not seem to be meaningfully weakening and inflation is steadily falling. These are optimal conditions for markets and risk assets, appearing as if the Fed has everything under control. The YTD market reaction makes sense in hindsight as everyone was positioned bearish, short, and/or on the sidelines going into 2023.
Moving forward - a few questions I’m thinking about are:
When does the economy turn more meaningfully lower or will severe recession be avoided, bolstered by historically high levels of fiscal spending?
What does the above mean for inflation? Will it return to the benign regime of the last two decades or is this decline just cyclical? If just cyclical while the secular forces are still present, when do they reemerge?
How constrained are commodity supplies relative to demand? Can prices remain resilient even through a potential recession due to a historically tight supply picture?
What is the Fed’s reaction function to the above outcomes? The latest SEP plot indicates they expect 1-2 more 25 bps rate hikes by year end (~5.6% FFR), despite inflation being well below that level by then.
Let’s start with interest rates
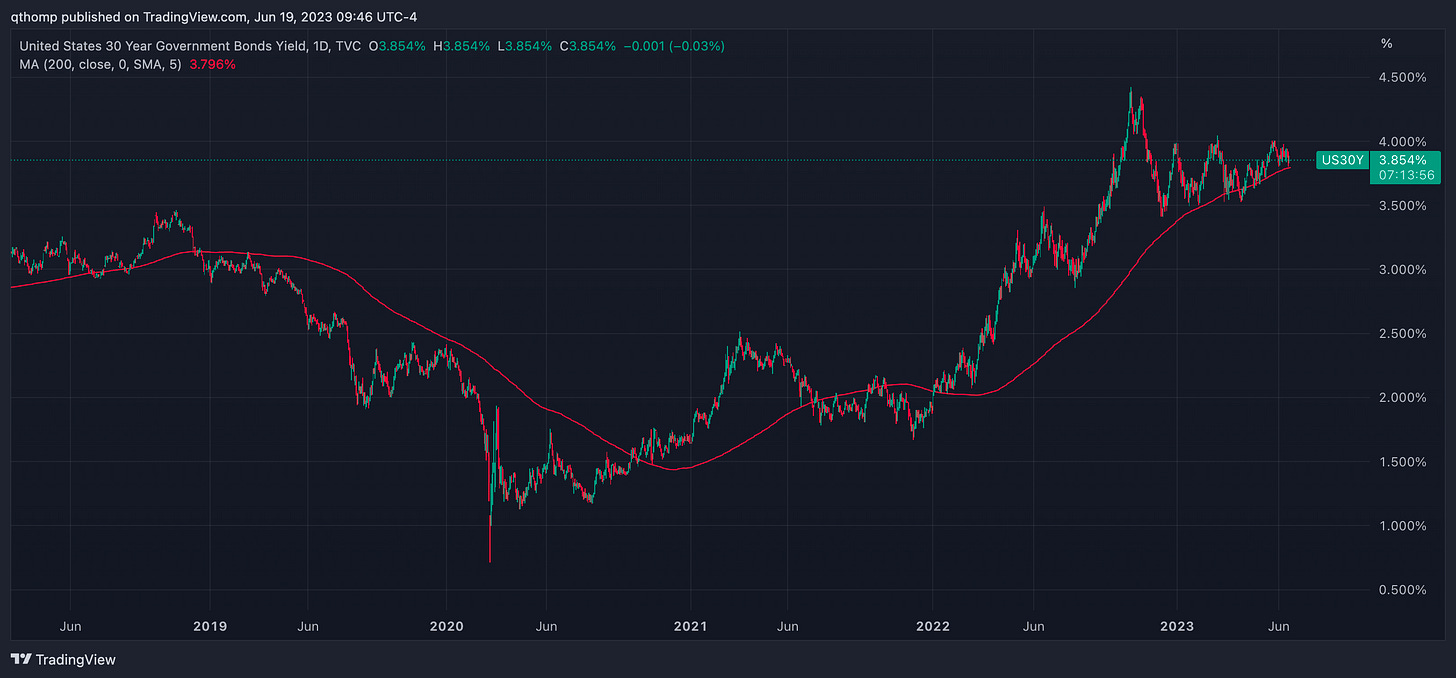
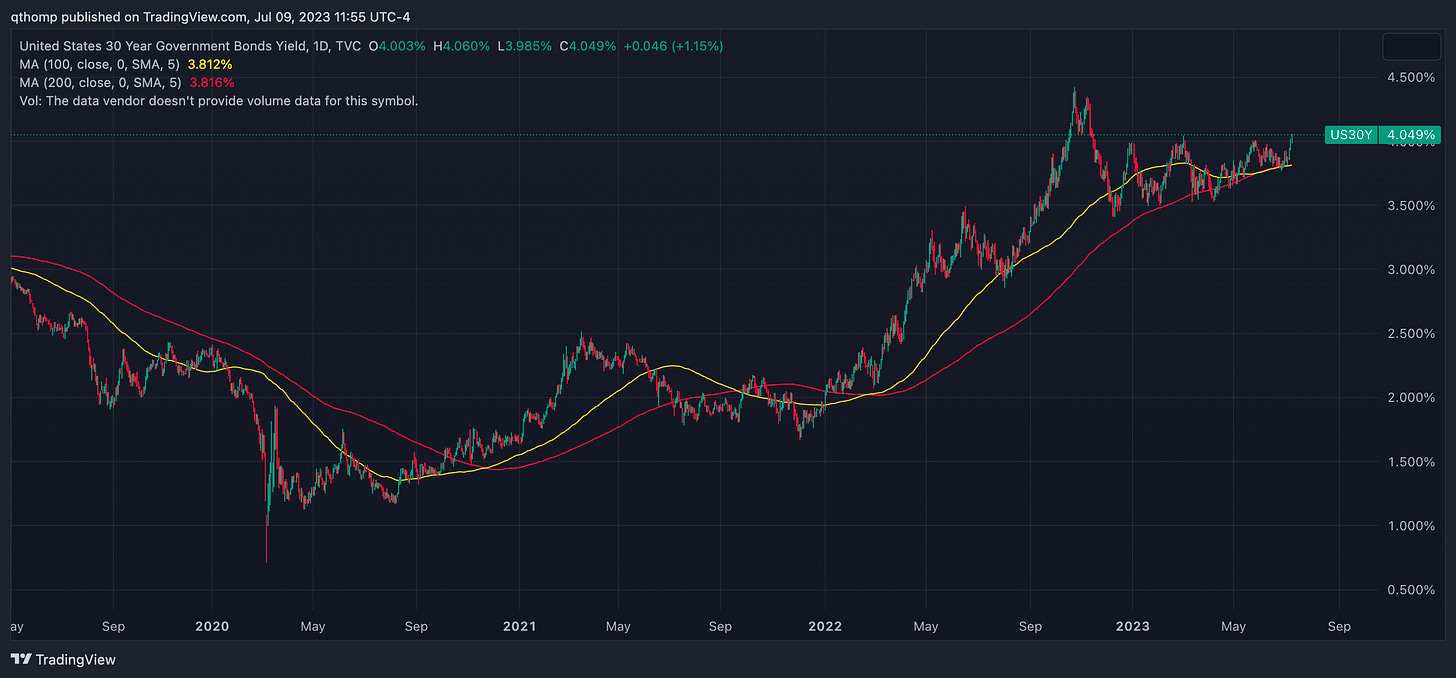
The 30yr treasury continues to look strong, remaining awfully resilient just below the 4% level which has not been meaningfully sustained since 2011.
June 19th
Current
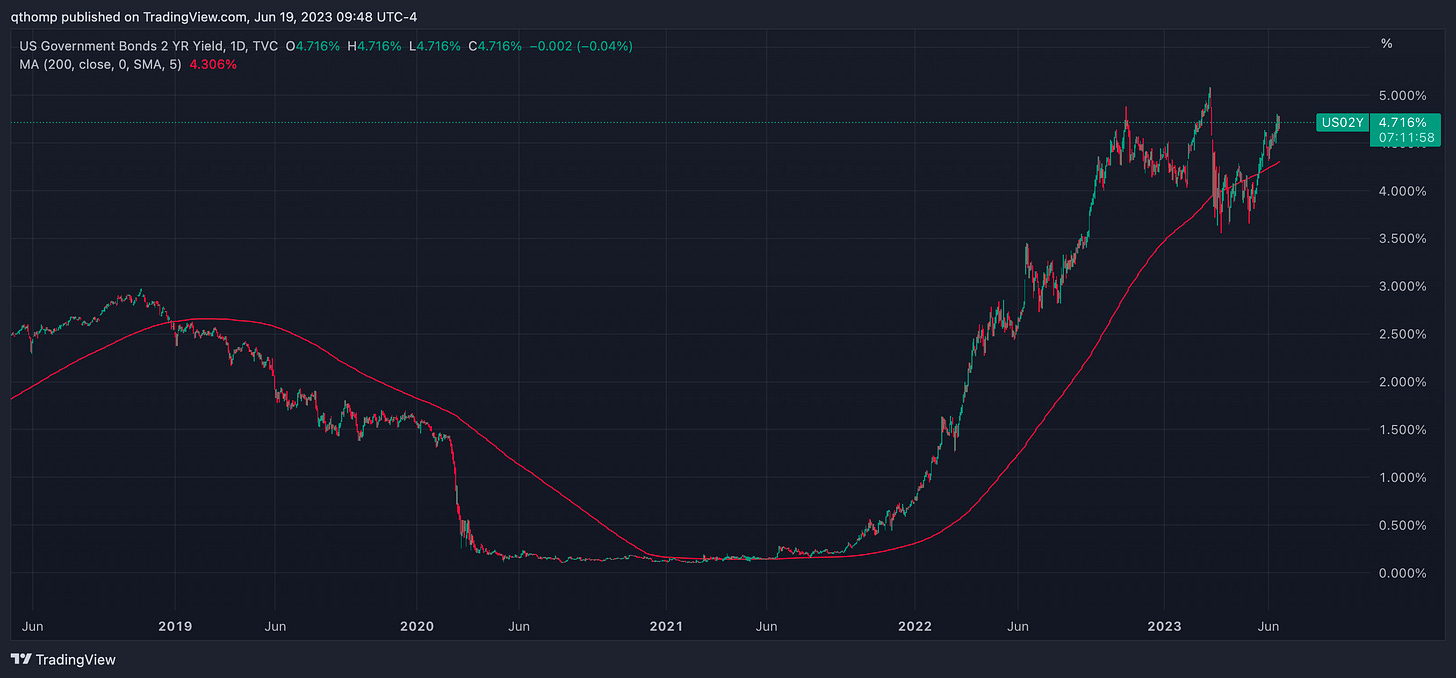
The short end (2yr or 5yr) has taken a meaningfully different path, but both are challenging pre-banking crisis levels.
June 19th
Current
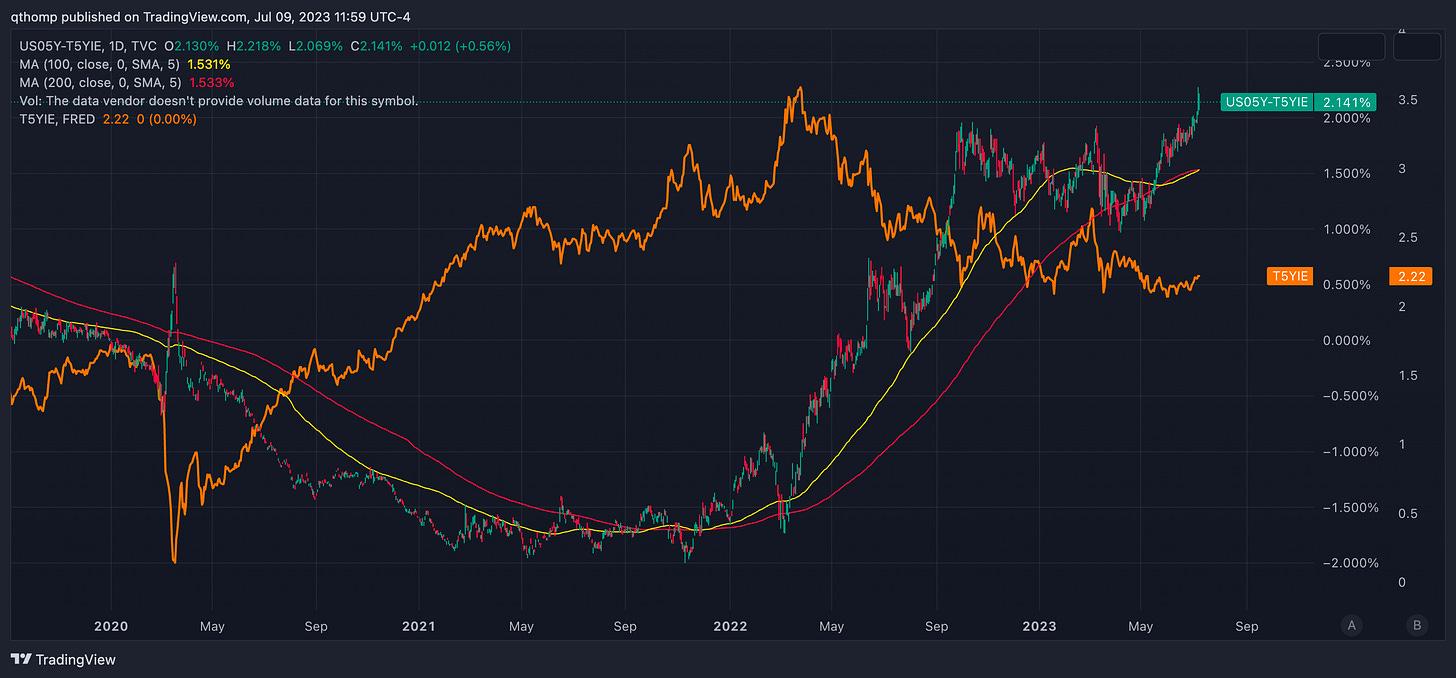
This recent upward move in nominal rates has brought real rates with it while inflation expectations (as measured via breakevens, the 5yr shown below) have not followed suit, although they remain sticky just above the 2% level.
June 19th
Current
What’s interesting to me is that despite the renewed surge in real rates (even now breaking out above previous highs), gold has remained strong. Last time real rates were at the 1.8%+ level in early March pre-banking crisis, gold was $100+ lower.
June 19th
Current
Is gold sniffing out either an impending drop in real rates or more banking problems? I tend to think so, which would indicate either inflation expectations/breakevens are too low at ~2% or nominal rates are too high at ~4%. Personally I’d bet more heavily on it being the former but I do think there comes a level where nominal rates wreak enough havoc that CBs again try to cap them (circa October ‘22).
June 19th
Current
I wrote in June that the way these break is quite meaningful for the rest of markets. For rates to move even higher from here (levels last seen pre-GFC), you’d imagine there would be an accompanying upward inflationary pulse. Then again, nominal growth is still well above trend and the record curve inversions don’t offer much term premium for a more uncertain inflation environment. If inflation continues to trend definitively lower, you’d expect rates to move lower as well, pricing an environment that looks more akin to the recent benign inflation environment. However, I think the data largely supports the fact that the low hanging fruit have been harvested in the fight against inflation and this is the part markets are having a difficult time discerning - how much of the move lower in inflation is driven by a cyclical factors, versus cured supply constraints.
Now over to commodities
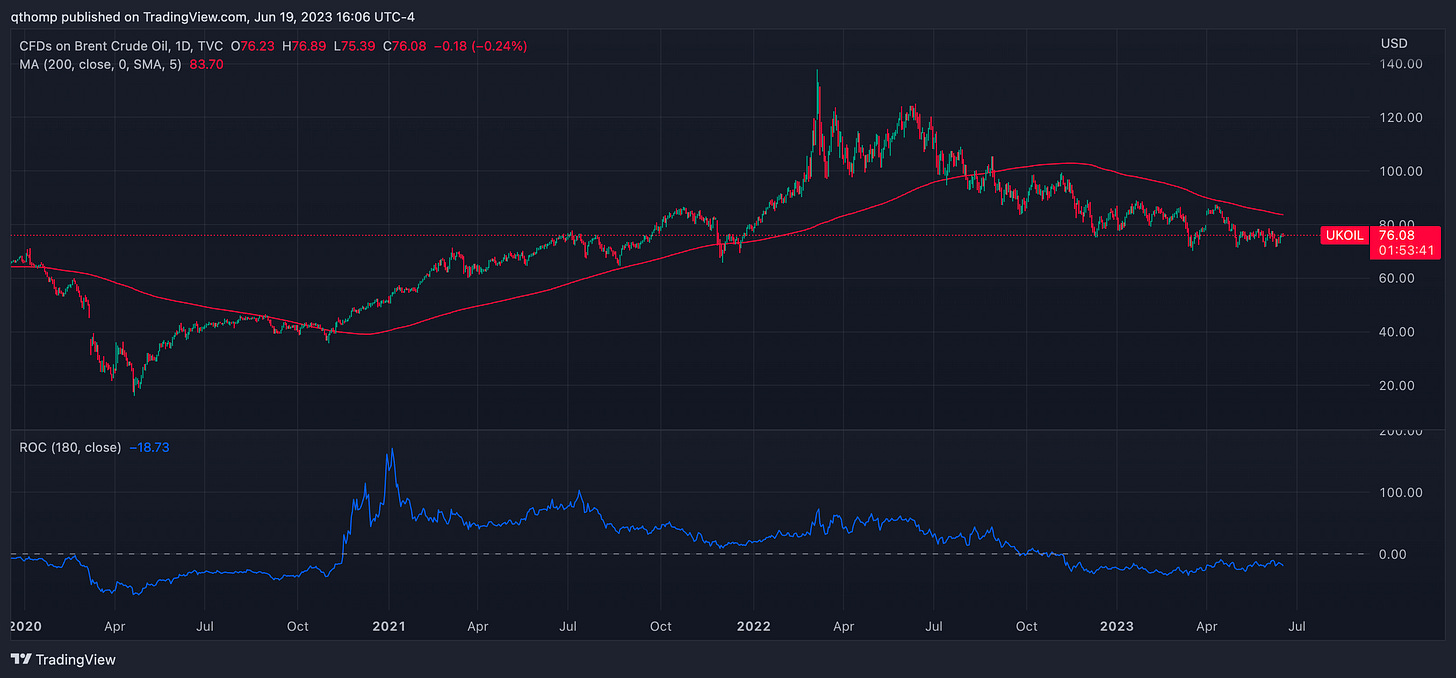
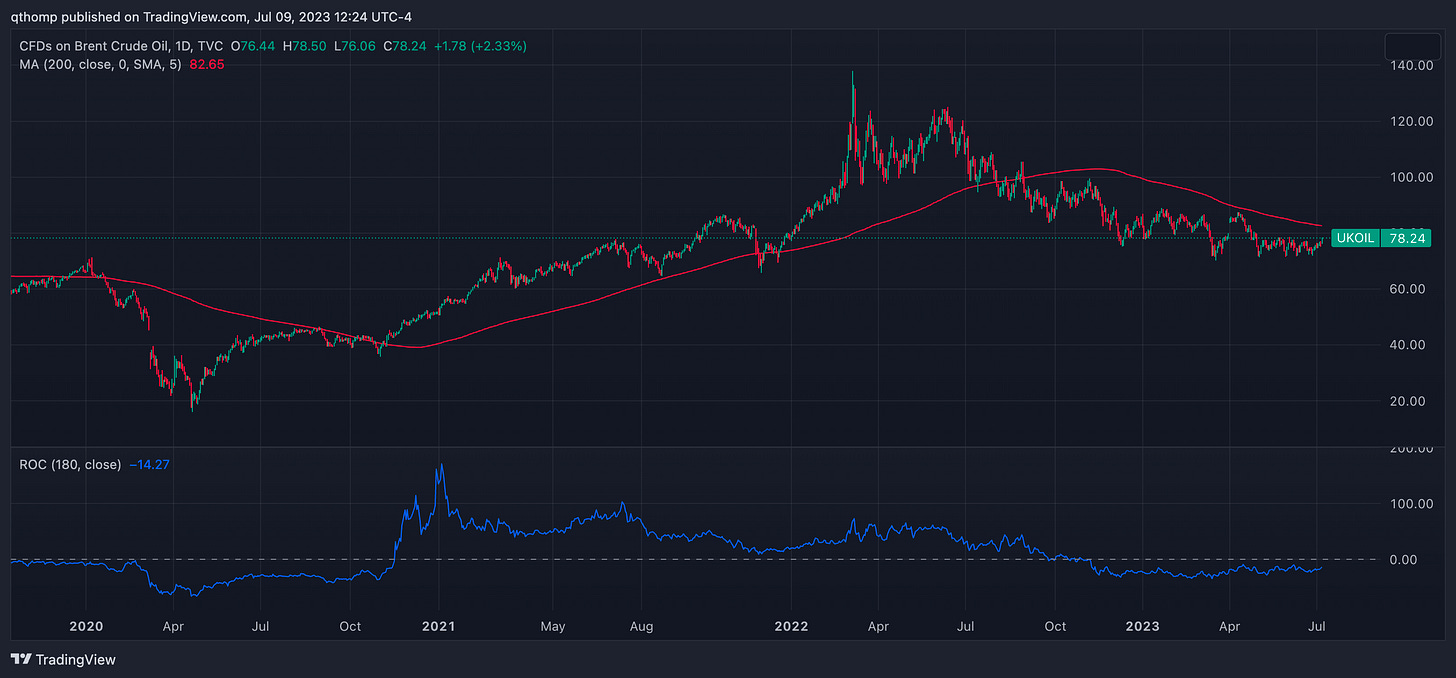
Oil prices have seemingly flattened out as the rate of change in price decline is shallowing.
June 19th
Current
Broader oil equities index, measured below via XLE, have held up despite the declining prices.
June 19th
Current
Offshore and oil services have remained an even firmer uptrend.
June 19th
Current
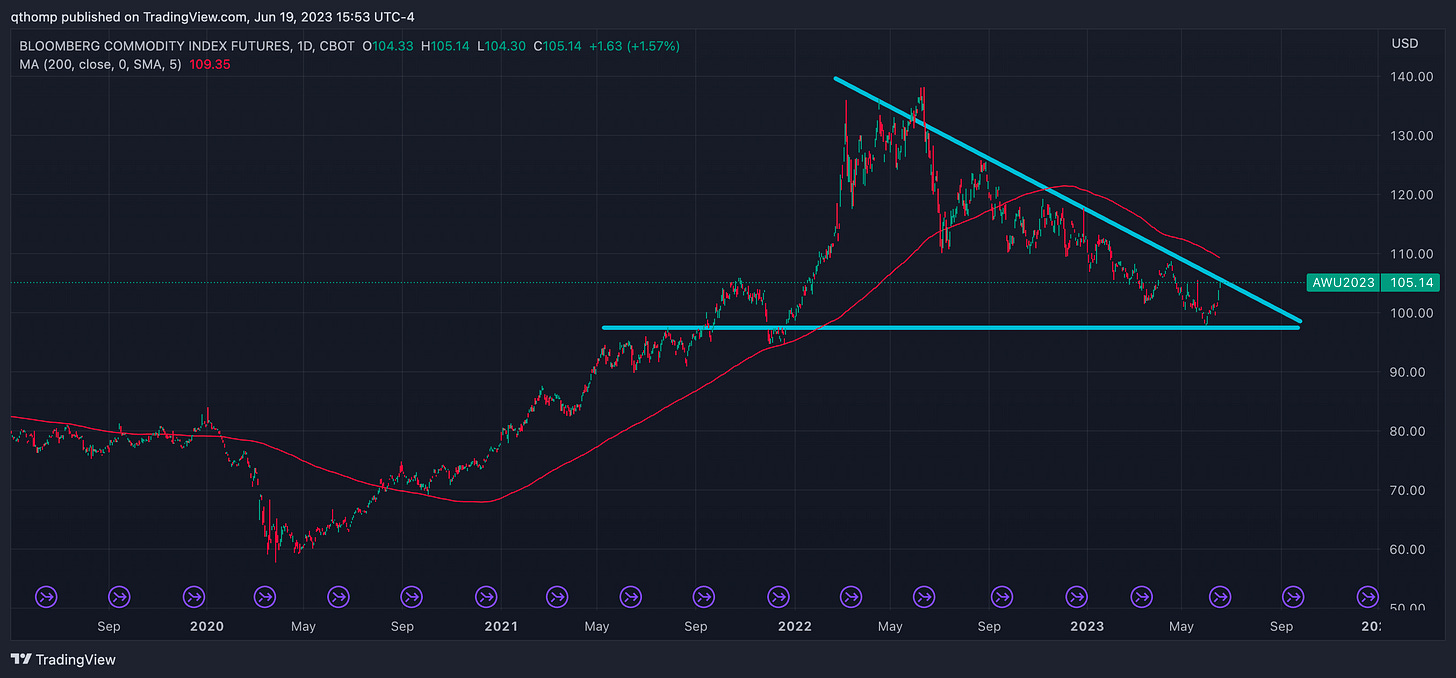
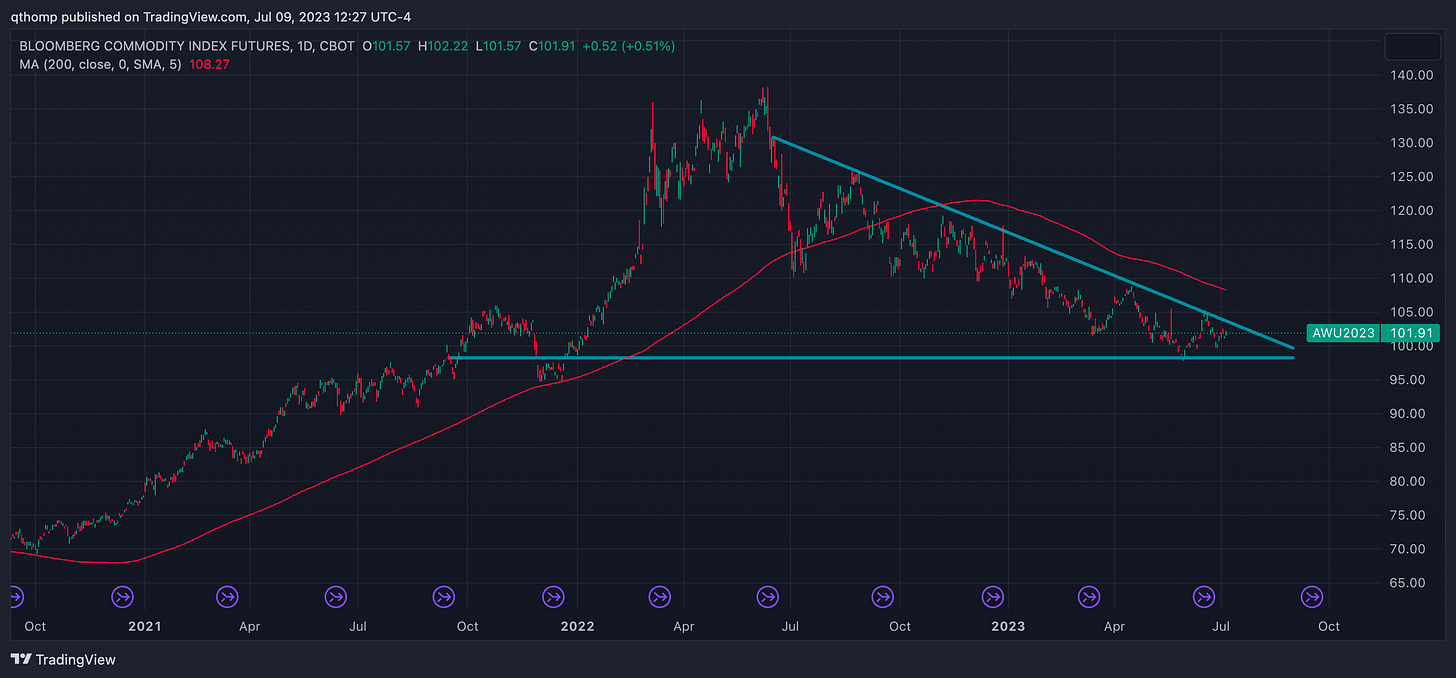
Looking across the commodity complex, the Bloomberg Commodity Index (aka BCOM) could also be forming a similar wedge, although admittedly a bit early to tell.
June 19th
Current
BCOM plotted versus agricultural commodities (DBA) shows an interesting divergence.
June 19th
Current
Why this matters is because breakeven inflation expectations and oil are almost perfectly correlated.
June 19th
Current
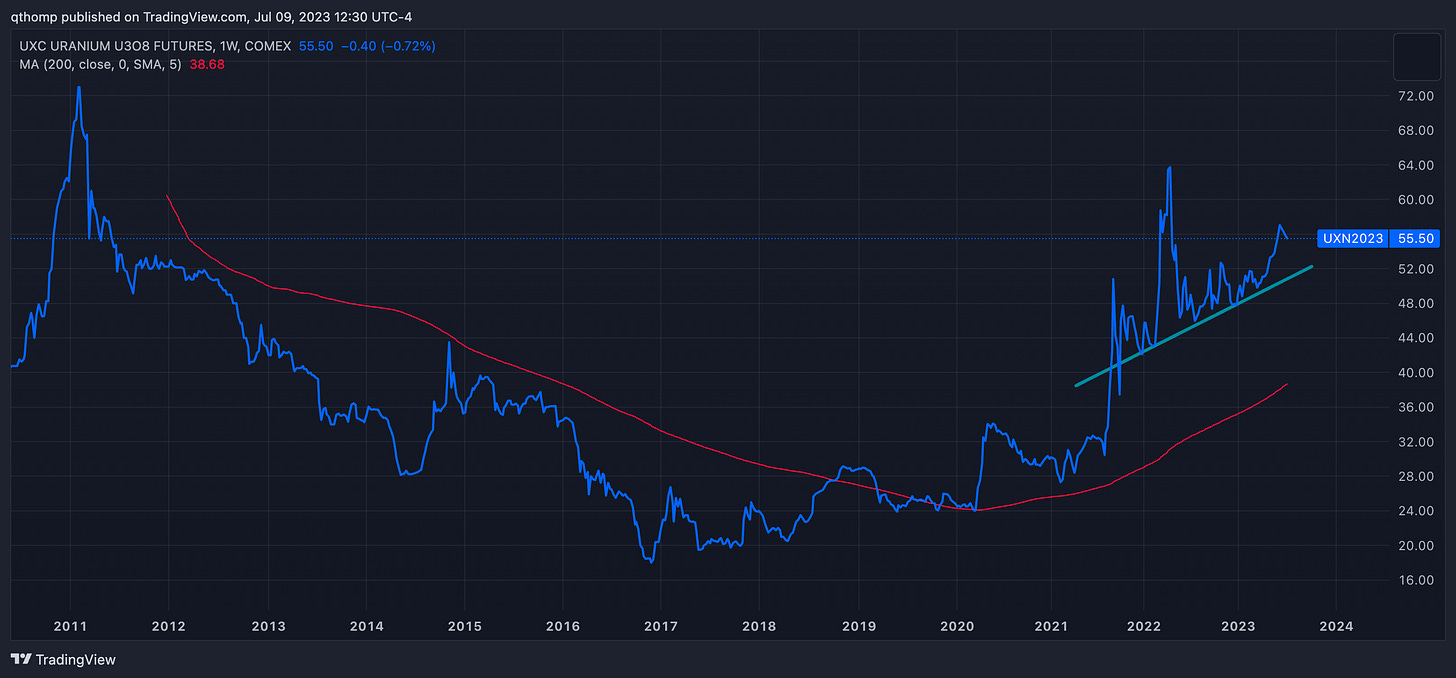
Looking across the commodity complex for other potential clues finds an interstingly strong uranium price chart.
June 19th
Current
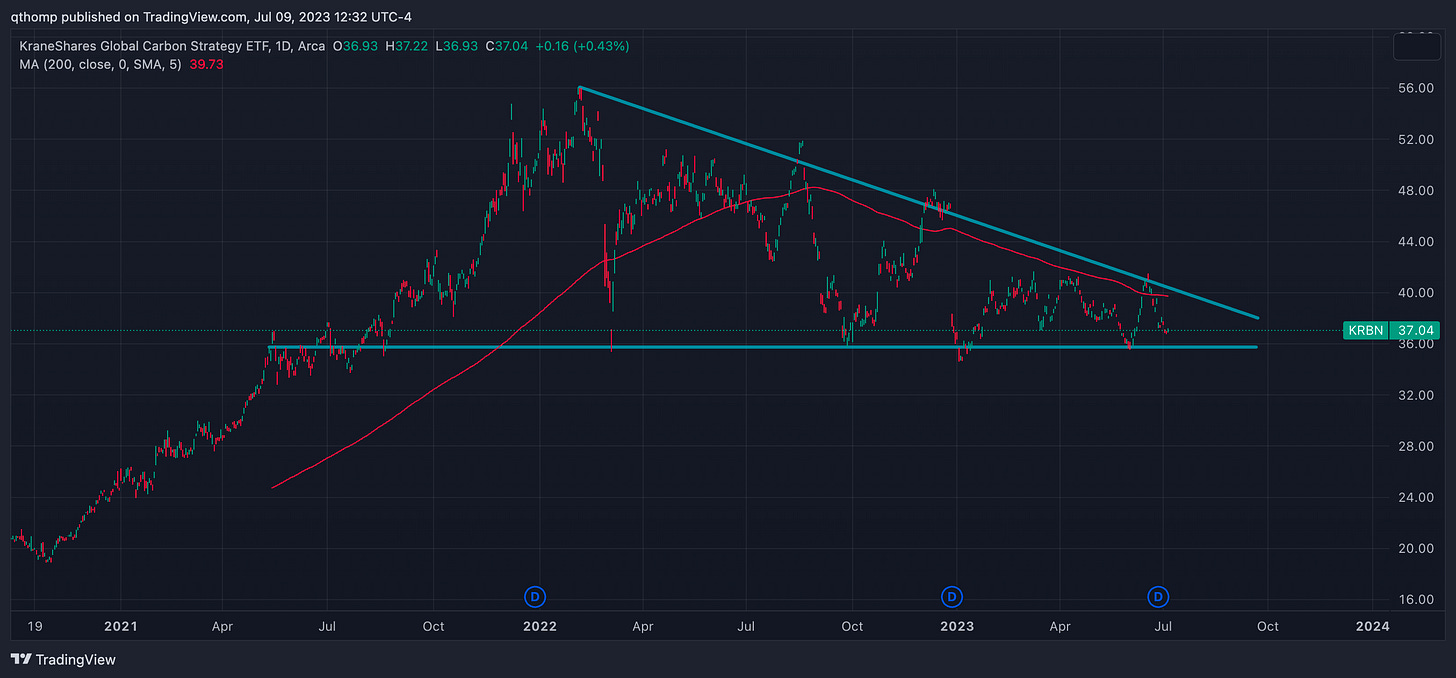
Heck, even carbon credits looks like the same wedge forming.
June 19th
Current
I’ve generally carried the belief that demand rules all for OpEx commodities like oil in the short-run. Even if the supply picture is supportive, it’s often difficult for commodity prices to hold up through recessions. But I wanted to test that by looking back to previous recessions for clues.
In the early 2000’s WTI crude oil was actually flat to up during two periods of rising unemployment (I’m equating this to a recession).
And even in the early days of the GFC, oil prices remained strong from January 2007 to July 2008 despite unemployment rising from 4.5% to 5.8%. Obviously things escalated to the downside and eventually demand ruled all.
But barring a GFC level recession or a COVID style shutdown (neither of which the Fed or governments could stomach without severe intervention), I think you have a pretty constructive picture for commodities. Particularly in a world where US fiscal deficits are at recessionary/war time levels (~8% of GDP) and the SPR has drained, you can almost visualize the two bolstering a floor on prices.
What to do
If the above thesis is correct and rates do resume their uptrend and/or inflationary pressures begin to reemerge, you’d expect this correlation from 2022 to regain importance (Nasdaq vs. 30yr Treasuries).
Recapping my initial questions with where I am leaning:
When does the economy turn more meaningfully lower or will severe recession be avoided, bolstered by historically high levels of fiscal spending?
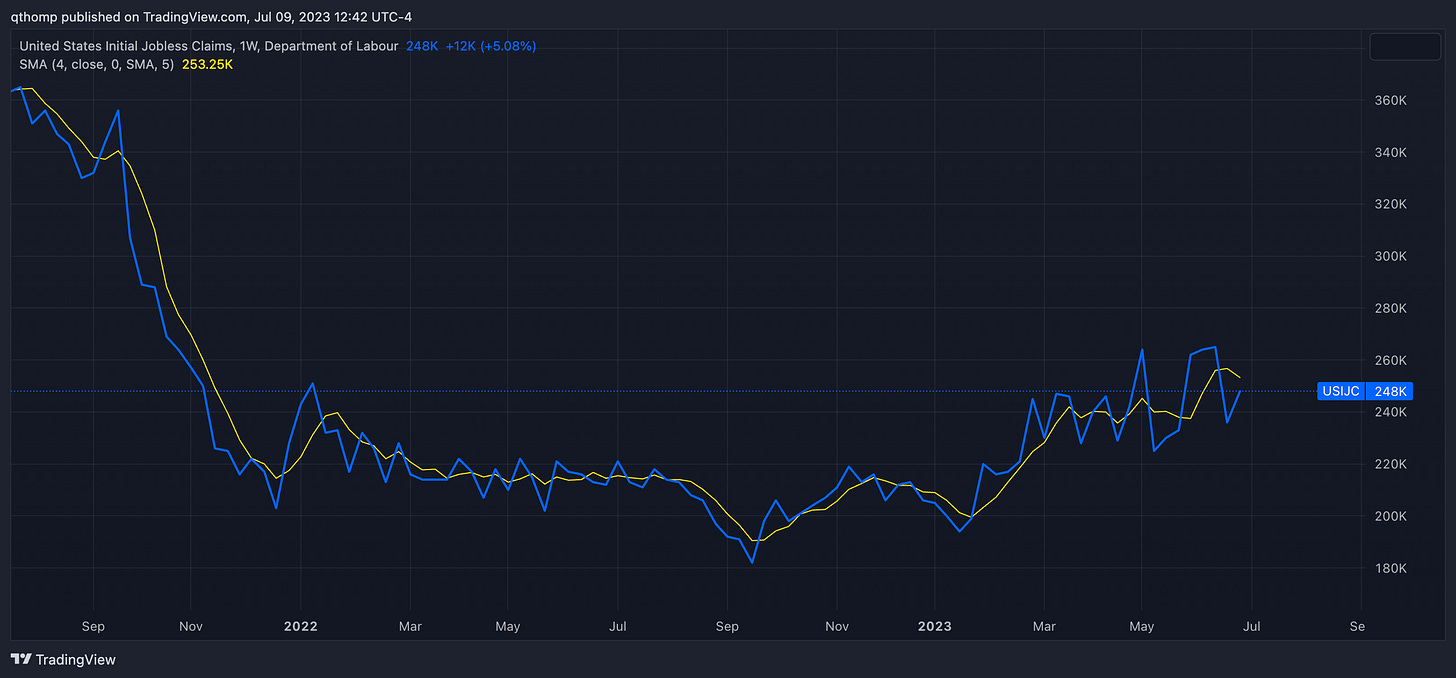
I do find it quite interesting that at exactly the moment all talks of any economic ‘landing’ have been thrown out the window, the 4 week moving average of initial jobless claims is rearing its head above multi-year levels. My gut says when the next bout of market troubles arise over the next 3-9 months, there will be more heft behind the recession concerns.
What does the above mean for inflation? Will it return to the benign regime of the last two decades or is this decline just cyclical? If just cyclical while the secular forces are still present, when do they reemerge?
I generally believe now that the inflation cat is out of the bag, those secular forces are here to stay. The fact that each Fed hike adds fuel to the fire by increasing the fiscal deficit and putting more money in savers pockets tells me we are seeing the early days of fiscal dominance. With nominal growth still above trend and governments’ inability to stomach a severe recession, it’s only a matter of time before the 2% inflation target gets abandoned in the name of financial stability (October’s central bank agreement and BTFP were yet additional clues).
How constrained are commodity supplies relative to demand? Can prices remain resilient even through a potential recession due to a historically tight supply picture?
The commodity supply constraints are evident to everyone but with the confluence of external forces (namely Russia/Ukraine, OPEC and the SPR), these markets sure have traded oddly. Now that we’re months past daily headlines predicting a European winter energy crisis and into the predictions of commodities performing falling off a cliff during the impending recession, as laid out above I think it’s a very interesting setup. You now have US rig count down -15% from its peak and DUC (drilled uncompleted) count down to decade lows, it’s only a matter of time before production follows suit without an uptick in price. Combined with the rampant fiscal deficit spending plus governments’ inability to stomach a severe recession, the setup for commodities looks quite positive even if there were to be an economic downturn.
What is the Fed’s reaction function to the above outcomes? The latest SEP plot indicates they expect 1-2 more 25 bps rate hikes by year end (~5.6% FFR), despite inflation being well below that level by then.
The only thing you can be sure of is that it’s going to be a mistake. As of now, the mistake looks like it will be a resumption of rate hikes just labor markets are beginning to crack. Their lack of adequate tools to fight the root causes of today’s inflationary environment will become even more apparent in the second half of this year.
Bitcoin?
I’d be remiss if I didn’t mention the orange coin. It’s one of the few assets in the digital asset ecosystem I am bullish on, which I discuss in greater detail here. The most interesting chart I can’t unsee is the 5 year log chart of BTC / Nasdaq. The upward trend is certainly clear. Maybe it breaks lower out of this wedge in the short-term? Who knows but I like the prospects on a medium to long-term.
As long as the Nasdaq and macro are holding up, I think there’s effectively a catch up trade to be had with Bitcoin, in addition to the strong potential upside catalyst of an ETF approval. For this reason I want to have long BTC exposure, albeit with a short leash if things turn in the macro picture.
More medium-term, I do not think BTC would be spared if the Nasdaq were to get hit. I think I am more constructive on BTC over Nasdaq on a relative basis (as depicted in the chart above), however in a low liquidity driven sell off I don’t think it matters. The caveat would be if there’s another March like financial or banking issue, but again that positive price action is more predicated on the government intervention after the fact than the event itself.
Additionally, a headwind for Bitcoin and digital assets is the lack of capital flowing into the space. The chart below shows the ratio of stablecoin dominance (as measured by USDT and USDC) / Bitcoin and Ethereum dominance. Said differently this is the % of total digital asset market cap comprised of stablecoins / % of total digital asset market cap comprised of BTC and ETH. A rising ratio means that stablecoins are growing relative to Bitcoin and Ethereum as a percentage of total market cap, and vice versa. The reason this is important is because stablecoin growth can be seen as a measure of investment capital flowing in and out of the space. This ratio has and will continue to rise as stablecoins make up a larger and larger portion of the ecosystem over time. But when it comes in contact with the lower trend line, it’s typically a bearish signal for digital asset prices.
Correlations don’t really tell a different story. BTC has ~somewhat~ decoupled from Nasdaq relative to 2022 where it was all one trade lower. However I wouldn’t read too much into it as their have been a number of idiosyncratic events on both sides (ie AI for Nasdaq; FTX, banking crisis and ETF for BTC).
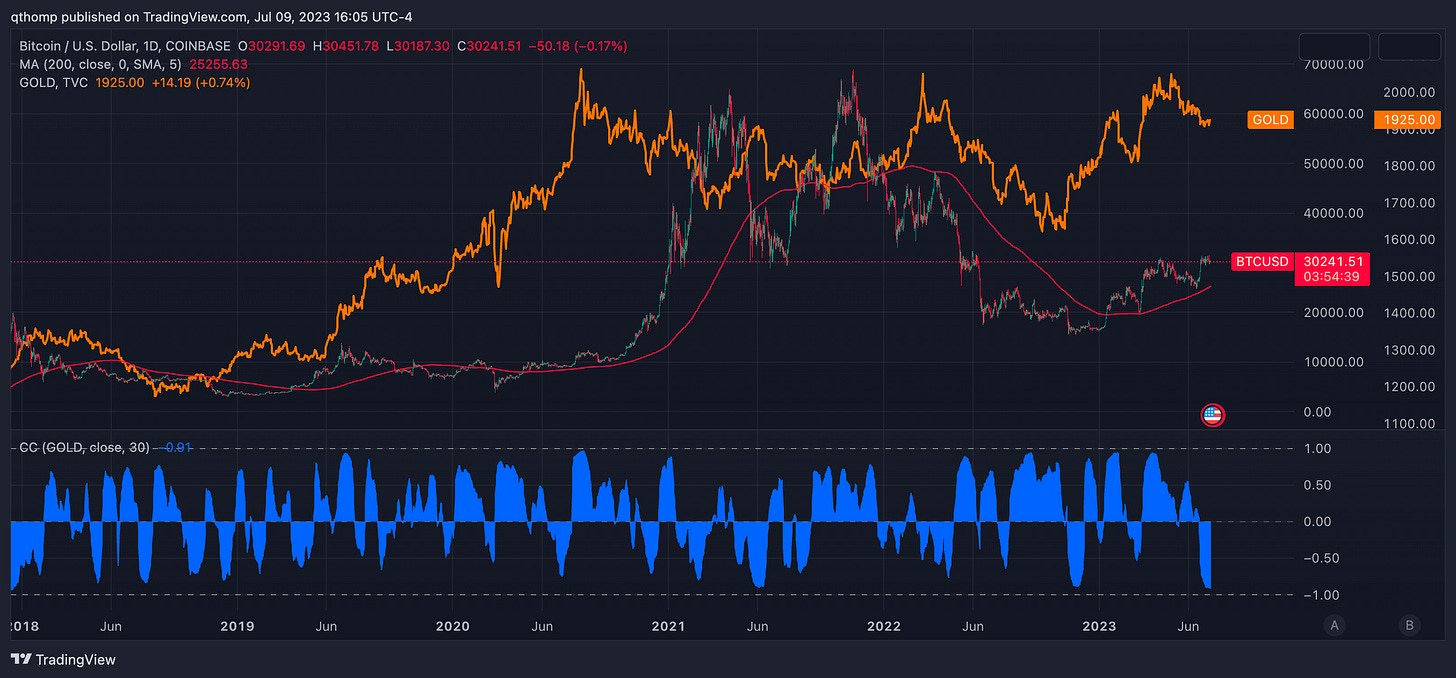
It’s a similar story for BTC and gold - no clear trend either direction, but if you account for the idiosyncrasies of FTX and Bitcoin ETF, it probably paints a more correlated picture.


