Q4: Santa or Scrooge
Back in July, I wrote about how interest rates and commodities are the biggest risk factor on my radar for markets. This has come to fruition and while nominal rates may flare up again, it’s unlikely they do so without an accompanying rise in inflation expectations. With real rates peaking, it’s time to position for what transpires next.
The economy: real vs. nominal
I recently wrote that the average market participant puts too much emphasis on nominal rates, often quoting things like “the economy can’t sustain 5% rates for very long. But in practice, we're living in a very different environment that now has persistent secular inflation. The reason the resilient US economy continues to defy expectations is because the world operates in real terms. 5% nominal interest rates with 3-4% inflation is actually not that big of a drag because GDP is still clocking in at 2-3% real, equating to 6-7% nominal. And it makes sense when you zoom out.
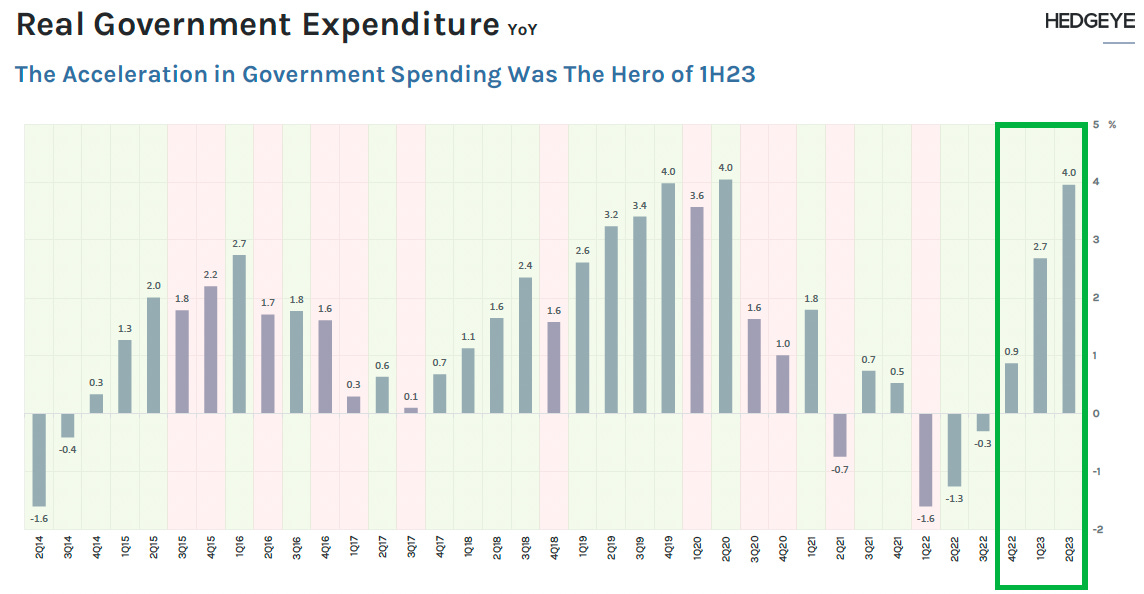
Normally during a recessionary period, the US government does two things: 1) spends to a fiscal deficit of 4-8% of GDP and 2) the Fed eases monetary policy. For the last 2+ years we haven’t been in a recession but the government is still spending at that pace.
This level of fiscal stimulus extends the cycle and papers over the otherwise would be cracks. It comes at a cost however, and is not sustainable in perpetuity - eventually either the spending or the currency has to give.
This also explains why the credit crisis and doom callers will continue to be wrong until at least next year. Unlike equity, credit investors perform the same when a company grows at 30% or 5% because their upside is capped. This environment will continue to surprise people in how supportive it is for fixed income. Credit spreads continue to tighten with the lack of supply from issuers as the majority of high yield borrowers termed out their debt in 2021. The soft / no landing narrative has gotten fixed income investors excited about deploying again after being on the sidelines for the better part of 2023. This is another example of where everyone got teased into the recession narrative for over a year and are now playing catch up.
One thing is certain though and that is corporate managers and the broader ‘herd’ are always late to the game. So it wouldn’t surprise me to see the ‘soft landing’ narrative escalate into a ‘no landing’ one while everyone continues spending and reinvesting over the next quarter, just in time for the economy to rollover as government spending falls, albeit still remaining high relative to historical norms.
So while I agree that the effects of structurally higher long term interest rates have yet to be fully priced in everywhere across the economy, I also think it's going to take longer than anyone expects. This delay has been caused by the covert yield curve control (YCC) that governments have been engaging in for a full year now. What started with the G20 finance minister meeting last October, followed BTFP in March and continued all the while via no long bond UST issuance in 1H 2023 as Yellen drove down TGA. All of these actions reduced UST sell pressure, artificially suppress cost of capital and helped fuel the strong year for risk assets as long duration was spared.
My base case for 2024 is that government spending does not provide the same tailwind. I believe sticky inflation will finally put the unsustainable fiscal spending into the limelight, which isn’t to say it will drop off significantly but just not provide the same year over year growth. The counter is that it’s an election year and politicians will do what they can to keep the economy supported, which I think depends on the narrative going into early next year. If inflation reignites or maintains persistency, there will be a pressure to bring that down and curb spending. Whereas if growth materially weakens the bias will lean towards spending. Timing is also important because problems could arise for incumbents if the latter occurs and then leads to the former before November.
Over the next few months it will be informative to watch the consumer to see if the problems facing the lower cohorts work their way up.
Interest rates
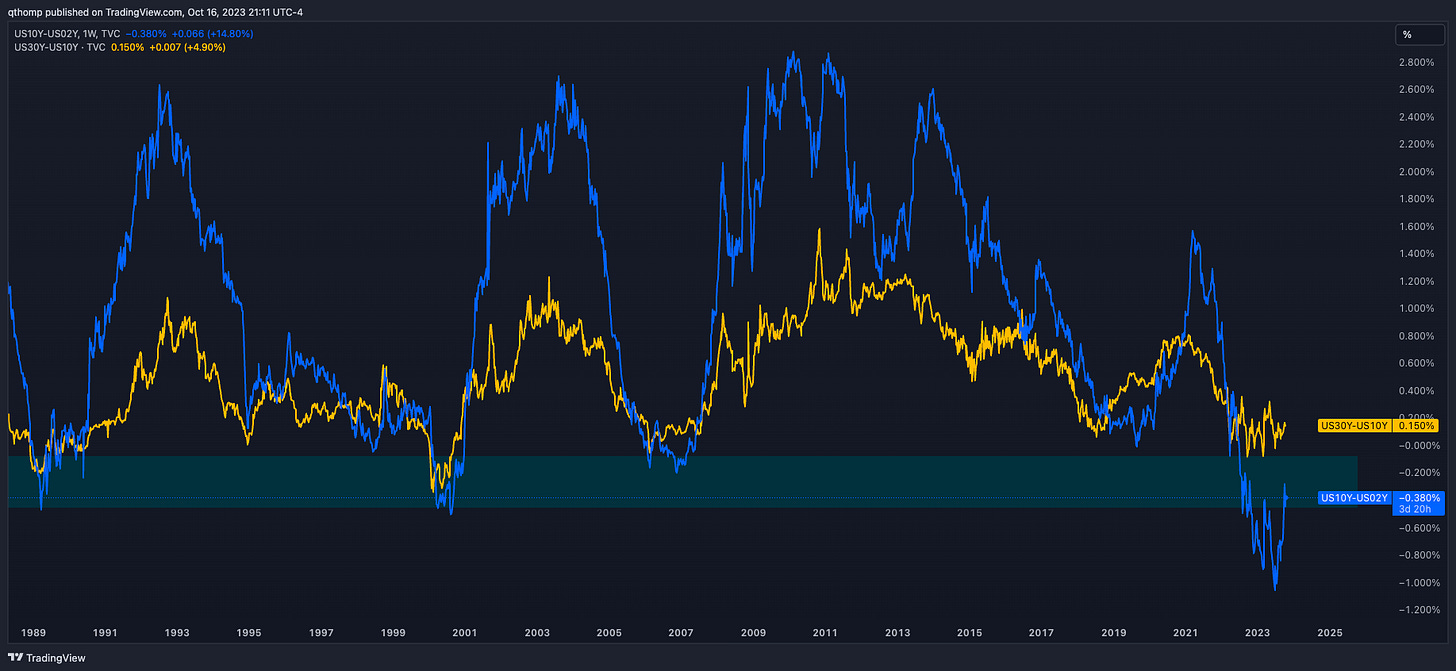
The talk of the town has been the 30 year US treasury yield’s vertical ascent up ~120bps topping out above 5%. Back in July I went on a long rant predicting this and estimated fair value was closer to…4.7%. Because of this large sell off in the long end of the curve (prices lower, yields higher), the yield curve has normalized closer in line with historical lows.
And as predicted, this further stressed banks.
But now just as “higher for longer” and the ascent in yields has gone mainstream, I think it’s likely yields are topped out for the time being. The 30yr treasury is at extreme oversold levels that typically marks peaks. I don’t believe this is where long rates peak for the cycle, but I do think they will cool off for a bit here.
The yield curve has uninverted swiftly in the past 3 months by ~70bps. What the below chart shows is 1) as mentioned above it is now much more in line with historical inversion levels and 2) further uninversions from here are often lead by rates falling, known as a bull steepener.
What very well may different this time though is how the curve steepens from here which may look more like a bear steepener due to long end rates rising. I don’t expect short-term rates to go lower in the near-term and if at all over the medium-term, not by much. The Fed has an impossible task on hand where it needs to keep financial conditions not too tight where it breaks something but not too loose where inflation runs again. But as long as inflation is still above the Fed’s target, they will be inclined to keep the short-end elevated and then when problems arise, it is the long-end that they intervene on which I think actually has much more reverberation through the economy that the Fed Funds rate. October 2022’s UK pension crisis and March 2023’s US banking crisis exhibited exactly this. Optically they can’t be seen to lower Fed Funds rate with inflation still this high, so they intervene to suppress long yields. It’s a bit of a circular problem though that I will dive into a bit later.
Nonetheless, I generally expect the yield curve to normalize over the next 12 months, albeit at a slower pace and probably a little stagnation at current levels for a bit. If it continues to uninvert at this pace, it would mean the markets are in serious trouble, which is part of the reason why I think it stalls here for a bit.
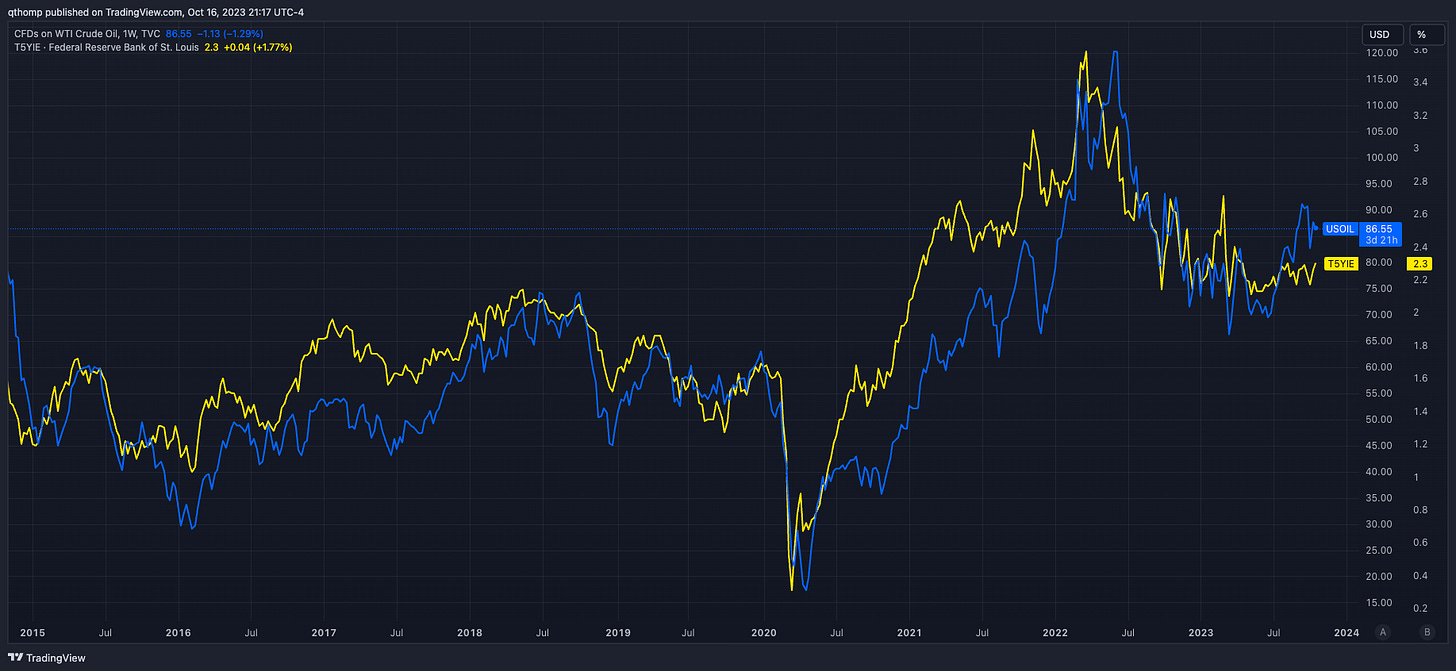
Along similar lines, I believe real yields (nominal less inflation expectations) have peaked. Whereas I think nominals could have higher to go next year, I think reals have peaked for this cycle. I think any move higher in nominals from here will require inflation expectations to also rise, which I do expect to happen over the next 12 months. I think oil will remain strong and I think inflation expectations will have to follow if it continues.
Commodities
Onto the topic of oil, let me share with you a few data points that help paint the picture of what’s going on.
The United States’ strategic petroleum reserve continues to be drained and now sits at 1983 levels.
Inventories are low across the board - including at Cushing.
And if you look at when Cushing stocks hit these low levels in 2014 and 2018, drilling activity as measured by rig count was much higher.
Today rig count is declining, despite low inventory levels and rising prices. Historically the rig count and prices were highly correlated, but post-COVID there was a separation as oil companies began to utilize already drilled but uncompleted wells (DUCs).
Thanks to the drawdown of the DUC wells post-COVID, US production has recovered to surpass its previous 2019 highs. There is a problem with this though. First, producers tap into their highest quality DUCs first and given the total number was nearly cut in half, the remainder are likely to be very low quality and uneconomic. This can be seen by the deceleration of the pace in DUC reduction. Secondly, the EIA estimates US shale production will decline in October with the Permian leading the way.
The US is giving up its role as the world’s marginal producer to Saudi and OPEC+ and the fact that Biden is required to come to Saudi’s terms on this latest deal displays as much. US producers are not rushing to drill even though profitability is at highs because they know that Saudi can ramp up production essentially overnight given the cuts they’ve implemented over the past year. Additionally, they operate in a hostile environment where they are shunned, and even taxed for running their businesses well.
Another signal that the US is choosing to die on the ESG sword is the recent cozying up to historical adversaries (Venezuela) and strengthening counterparts (Russia, Saudi) while weakening our national security and domestic production capacity. This will make the Fed’s job even more difficult going forward as it puts an implied floor on prices, whereas for the past 8 years it was the opposite.
One area this can be seen is in the difference in the dollar and real rates when the US is the swing producer (last ten years) versus when OPEC plays that role. As you will see pre-2013 when oil rose, real rates and the dollar fell as the US ~imported inflation~. That relationship changed during 2014-2016 and 2018-2020 when oil fell, the dollar strengthened but real rates fell as a flight to quality in the face of a slowing economy.
And most recently we’ve seen oil, the dollar and real rates rise as the US has been ~exporting inflation~ to the rest of world. This is why most countries had even worse inflation problems - the US has been relatively shielded via the strong dollar and energy exports. Europe and the weakening Euro have not been as lucky.
I think this relationship is starting to change though. As the US continues to cede its energy independence to OPEC, it’s likely that the relationship from the early 2000s returns, whereby oil rises, the dollar and real rates fall as we are back to ~importing inflation~.
Currencies
I briefly mentioned the dollar above, although FX is not something I really trade. I do however find looking at relative currency strength as a tool to better understand other asset classes or trends. And I think one area that’s important to call out is the effect a strong dollar has on other countries. For example you will notice in this chart how the dollar has strengthened much more relative to the large Asian economies’ currencies (as DXY is largely a dollar / Europe cross).
This is relevant because China and Japan are two of the largest holders of US government debt. So when they are attempting to defend their currencies, they often sell treasuries, which creates a reflexive effect sending US rates even higher and further strengthening the dollar. This was one of the causes of last October’s global intervention and has been ongoing again the past few months.
The most common line heard from dollar milkshake theorists and other perpetual strong USD proponents is that “no central bank can outhawk the Fed”. In normal circumstances this is probably generally correct as it points to the relative strength of the US economy and our energy independence (for now) versus rest of world. But what this view fails to incorporate is that it’s largely out of central banks’ hands at this point, which is also known as fiscal dominance. The dollar bear thesis is actually that interest rates move too high, causing market disruption and that the Fed is forced to enact YCC. Hint: this has already occurred.
Now that the inflation and fiscal dominance cats are out of the bag, there are trade offs to monetary policy decisions. You can bolster financial markets and the economy by providing liquidity, but it will come at the sacrifice of your currency. For example, take a look at gold priced in Yen. So while the Fed will be forced to support the US Treasury’s deficit spending by printing more money, foreigners will start to catch on and ditch some of their US assets in tandem, all helping to weaken the USD.
Putting it all together - fiscal dominance
I have been talking about fiscal dominance for some time now but you can finally start to see the pieces coming a bit closer together as it’s coming to a head. The levers that the US government has to pull are running dry.
One of those is the Fed’s overnight reverse repurchase agreement facility, which until just this past week you hadn’t heard a peep about since earlier this year (I’ve been slow to drafting this post for about 2 weeks now which I’m annoyed with because there’s been a couple good threads on this topic that have stolen my thunder). @PauloMacro on Twitter has been the most active on this topic and I tend to agree with him on many things.
Here’s the daily chart of the Fed’s RRP balance.
And for another perspective, here’s the monthly.
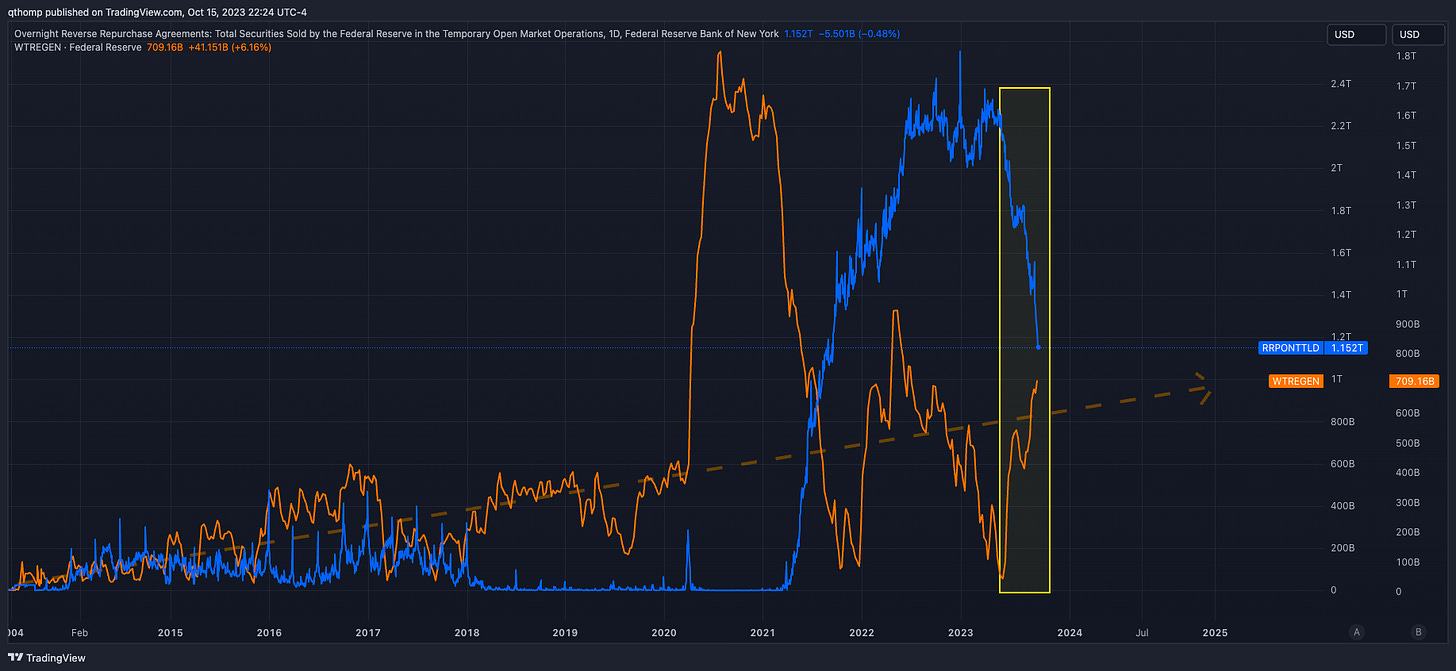
Do you think it’s a coincidence the RRP has fallen by $1T in four months since the US debt ceiling was lifted? Why? Because the Treasury needed to start issuing debt again and the RRP is helping to soften that blow. It was ~$2.3T in the middle of April and $2.15T in the middle of June. Today it’s at $1.15T - averaging ~$250B per month. At this rate, it starts to look tapped in Q1 2024.
For additional context, let’s overlay the TGA account with the RRP balance. There’s both a clear uptrend in average TGA balance over time coinciding with larger nominal deficits, as well as correlated timing between the RRP falling and TGA rising. The RRP has fallen sharply by ~$1T while the TGA has risen by ~$700B. It’s clear Yellen is exhausting all of her resources to try to prevent a tumultuous rise in yields as she floods the market with treasury supply.
Another interesting angle is looking at the most recent large TGA refills dating back to 2019 against the Fed’s balance sheet, MOVE index and 10 year yields. The first two (2019 and 2020) were accompanied by an expanding Fed balance sheet and falling interest rates, while the most recent two (2021 and 2023) were the exact opposite.
So what is the Fed to do? Cross their fingers and try not to break anything until the inevitable phone call from Yellen when they finally do. The worst part is it’s not even the Fed’s fault at this point - the baton has been passed to congress’s rampant fiscal deficit spending. The battle against inflation is out of their hands and this is what bond markets are acknowledging.
Keep in mind oil is trading like this when China and much of the global economy is extremely weak. As the US economy joins in the slowdown over the coming year, the government and Fed will be forced with the decision to ease monetary policy and fiscally stimulate the economy, further stoking oil and inflation, or let the markets suffer. Based on how quick the reaction function has become during market turbulence, they’ll choose the former. It would be politically unfathomable for them to do anything different. Back in July, I wrote how oil can now stay strong despite a recession.
How to trade my views?
My general timeline is that the US economy slows over the next 6-9 months as the consumer weakens and governments are pressured to reduce fiscal deficits. Due to government spending, GDP is likely to sustain positive growth rates on a nominal basis which will support oil and put a floor on interest rates. I expect global oil and commodity production will continue to shift power towards OPEC and away from the US which will make the Fed and Treasury’s job even more difficult.
My base case is that this 5% mark is a soft line in the sand that will garner a concerted effort to maintain. I expect rates and oil to back off a bit or at a minimum stall / slow their ascent. It would not surprise me to see an equity rally into year end as investor positioning remains underexposed and this recent selloff appears to be oversold.
Meanwhile as it takes time for the economy to weaken more meaningfully (long and variable lags) and we approach the end of the RRP in Q1, I could see troubles resume. Maybe oil firms up again going into year end and takes a run at $100 in early Q1, sending rates higher at the exact time the Fed loses a key piece of its funding equation. This would force the Fed and governments to once again reign in the long end just as inflation expectations begin to rise, making matters even worse. I don’t see a pivot on rates but rather more manipulation of the curve via YCC. As long as inflation is present, they will not be able to be so blatant about lowering the Fed Funds rate so they will resort to more covert tools that the average person won’t understand.
All of this is extremely bullish gold as real rates go lower. I think you also see Bitcoin start trading more closely in line with gold here as well. Maybe Bitcoin is slow to pick up on it but those would present buying opportunities because if the government were to let the situation go untended to, it would cause another banking problem and the end result would be the same. The risk of course would be a really bad market liquidity event, but even then it’s very difficult to see the Fed not stepping in.
For equities, the picture is not obvious. I think earnings will be important and while the economy may very well slow, it may not dip negative. Given it’s an election year they will be trying to prop things up but keep inflation in check. So on a nominal basis it wouldn’t surprise me to see an upward drift. It’s difficult to envision a repeat of the 2022 downward drift with rates seemingly close to a top. For me a lot will depend on where unemployment levels are at and what consumers are fearing most going into the election, economic downturn or inflation.
Crypto
We’ve had large liquidations, ETH futures ETF launch, government intervention beginning, SEC/regulatory mean reversion, changing political climate and stablecoin supply bottoming. My general view is that gold does well, but Bitcoin does better. I am still pretty bearish on-chain activity and therefore the majority of assets outside of Bitcoin. I think you want to be positioned for a rise in Bitcoin dominance.
Banks
I think short the banks, long Bitcoin is finally a very tradeable thesis. Banks are in a lose / lose. If the Fed let’s the long end go, banks’ balance sheets get smoked. Meanwhile if they enact yield curve control and put a lid on the yield curve, banks’ profitability gets crushed. The Fed needs to find a way to slow the bleed of capital flight and balance sheet weakness. The old saying - if you hold a 30 year bond until maturity you won’t have mark to market losses. So you have a situation where their balance sheets are broken, profitability is shot and then when you mix in a slowing economy with contracting credit and wider spreads, it really doesn’t paint a great picture. Charles Calomoris wrote a great paper on a potential path for the Fed in forcing banks to hold more treasuries. This may start to look a lot more viable once the RRP runs out.


